Introduction
SyncTide is a self-hosted industrial monitoring platform. It reads from your field devices, watches every value, raises alarms the moment something drifts out of range, and produces the reports your operators rely on — all on a server inside your own plant.
Data is collected directly over Modbus TCP, OPC UA, IEC 60870-5-104 and MQTT / Sparkplug B, or imported from CSV files. From there SyncTide presents real-time dashboards and maps, generates Excel and PDF reports on a schedule, and sends multi-channel alarm notifications by SMS, email, Telegram and WhatsApp.
Who this guide is for
This documentation covers day-to-day operation for Viewers and Operators, and full system administration for Admins. If you only monitor dashboards and acknowledge alarms, the Using SyncTide chapters are all you need. If you set up devices, users and gateways, continue into Administration.
What SyncTide does
- Ingest — five native protocol drivers plus CSV folder watching, one worker per protocol.
- Watch — threshold, digital, totalizer and operating-curve alarms with per-tag rules.
- Notify — one escalation engine across SMS, email, Telegram and WhatsApp.
- Report — scheduled PDF/Excel exports, per-customer branding, auto-emailed.
New here? Read Signing in and Home & asset tree first — they explain the navigation and the colour-coded device status you'll see everywhere.
Signing in
SyncTide is a single-page web app served by the platform itself. Operators on phones and tablets open the same URL as the control-room desktops — no client to install.
Open and log in
- Open a browser and go to your SyncTide address —
http://<host>on the plant LAN (it lands you on the app at/uiand the sign-in screen). - Enter your username and password.
- If multi-factor authentication is enabled on your account, enter the 6-digit code from your authenticator app (or a one-time recovery code).
- Pick your language — English or Português (Portugal) — from the top bar.
From v1.2 the interface is a fast React single-page app (the earlier page-by-page UI is retired). Navigation no longer reloads the page; your role and equipment scope decide which sections appear.
Two-factor authentication (MFA)
SyncTide supports time-based one-time passwords (TOTP). Enrol from My Account → Security: scan the QR code with an authenticator app, confirm a code to switch it on, and store the 10 recovery codes somewhere safe — each works once if you lose your device. Administrators can require MFA for an account; until it's set up, that user is prompted to enrol before reaching any data.
First login & passwords
If you are signing in with a default password, SyncTide forces you to change it before you can continue. Passwords cannot match common defaults such as admin, password or 123456.
Can't log in? A wrong password or a deactivated account are the usual causes. Ask your administrator to verify your credentials or reactivate the account — see Troubleshooting.
Roles & access
Every account has one of three roles. Roles set what you can see and change; administrators can further narrow access to specific equipment.
The three roles
| Role | Access | What they can do |
|---|---|---|
| Viewer | Read-only | View dashboards, reports, the map and messaging history. Cannot change any configuration. |
| Operator | Read + messaging | Everything a Viewer can do, plus manage messaging contacts, escalation lists and alarm rules. |
| Admin | Full access | Full control: user management, equipment configuration, gateways and system settings. |
A full permission matrix — feature by feature — is in User administration.
Home & asset tree
The Home page is your entry point: a welcome with your role, quick-access cards to the Dashboard, Reports and Messaging Center, the asset tree on the left, and a live map of device locations.
The asset tree
The asset tree organises every monitored device into a hierarchical category structure. Each device carries a colour-coded status dot:
| Indicator | Status | Meaning |
|---|---|---|
| Green | Online | Sending data normally, no active alarms. |
| Red | Alarm | One or more alarm conditions are active. |
| Grey | Offline | No data received within the configured timeout. |
Click a device name to expand its alarm details. Open alarms appear in a scrollable list (up to five visible at a time).
Acknowledging alarms
Acknowledging tells the system — and your colleagues — that you are aware of a situation. You can acknowledge at three levels:
- Per-alarm — click Ack next to a specific event.
- Per-device — click Ack All on a device to clear all of its alarms at once.
- Global — click Ack All at the top of the asset tree to acknowledge everything.
Acknowledging does not clear an alarm. The alarm stays active until the underlying value returns to normal — acknowledging only stops the escalation.
The interactive map
The map plots devices as coloured dots (green / red / grey). Hover a marker for device details. Devices without coordinates are listed below the map. Free CARTO tiles are used by default; satellite imagery is available when a Mapbox API key is configured.
Dashboard
The Dashboard is the curated live overview of your site — headline KPIs, active alarms ranked by severity, and the equipment list, all refreshing on their own.
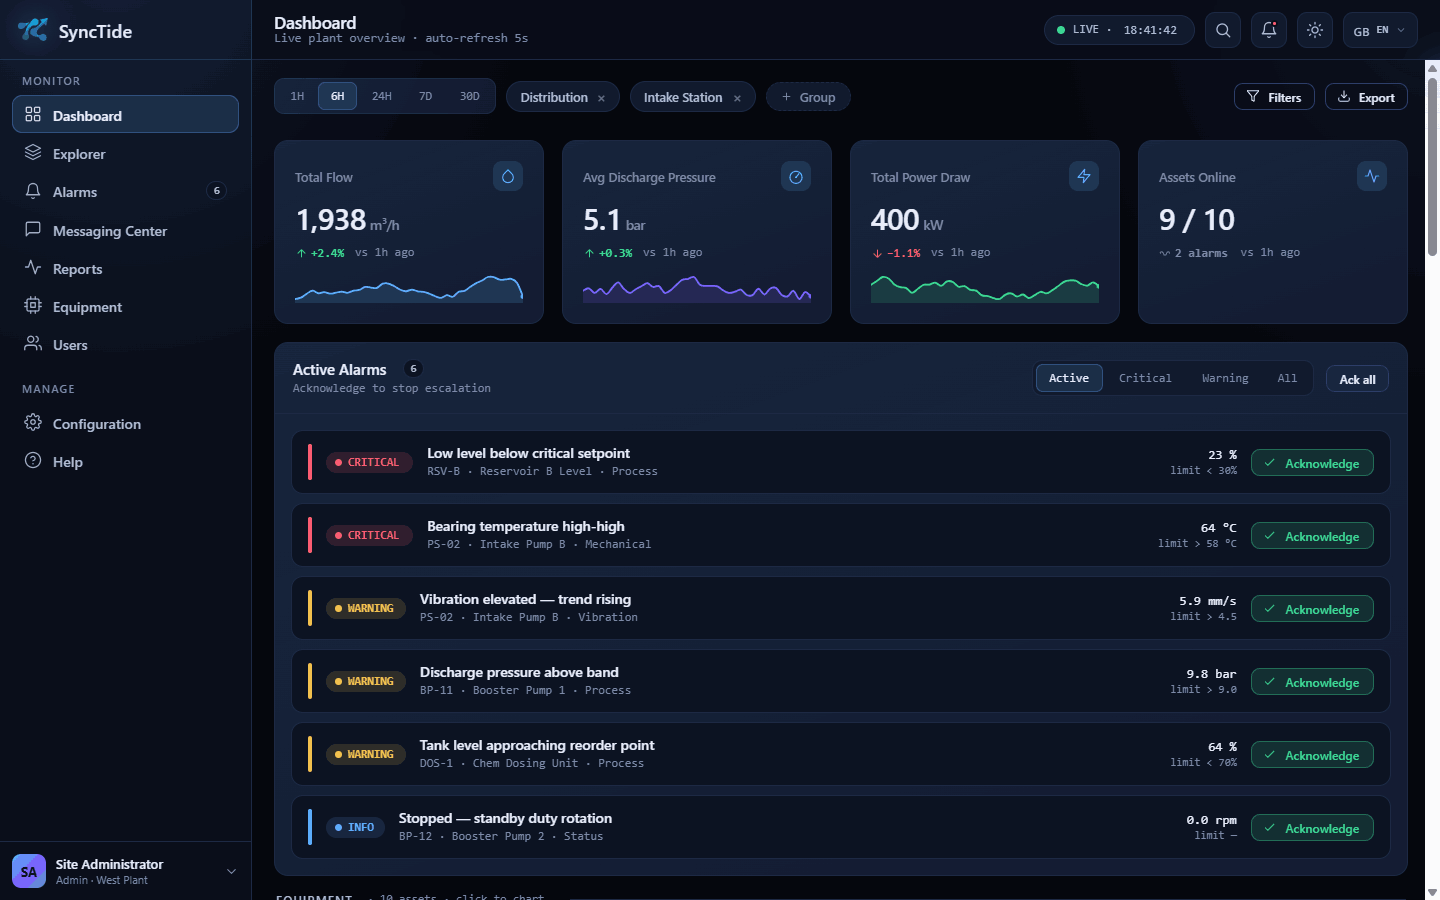
Summary metrics
The KPI cards show system-wide figures at a glance, with the trend direction versus the previous period:
- Total flow / pressure / power and other site KPIs, each with a sparkline.
- Assets online — how many devices are reporting, and how many carry active alarms.
Filters & time range
Use the filter bar to choose what you're looking at:
- Group — narrow to one or more equipment groups (e.g. Distribution, Intake Station).
- Time interval — presets from 1H to 30D, or a custom range.
For wide date ranges the system automatically aggregates points into hourly or daily buckets to stay responsive; an indicator below the chart shows whether you're viewing raw or aggregated data.
Active alarms
The active-alarm panel lists every open event, ranked by severity, with the measured value and the threshold it breached. Filter by Active, Critical, Warning or All, and acknowledge individually or with Ack all. Acknowledging here stops escalation just as it does on the asset tree.
Data table & export
Below the chart, a table shows the raw measurements behind your current filters. Use the download button to export them as CSV for Excel or other tools.
The raw table is capped at 150,000 rows for performance. Narrow the time range if you need a specific slice of data.
Explorer
Where the Dashboard is curated, the Explorer is the free-form builder — mix any tags across any devices, choose how each plots, and compare them on shared or per-unit axes.
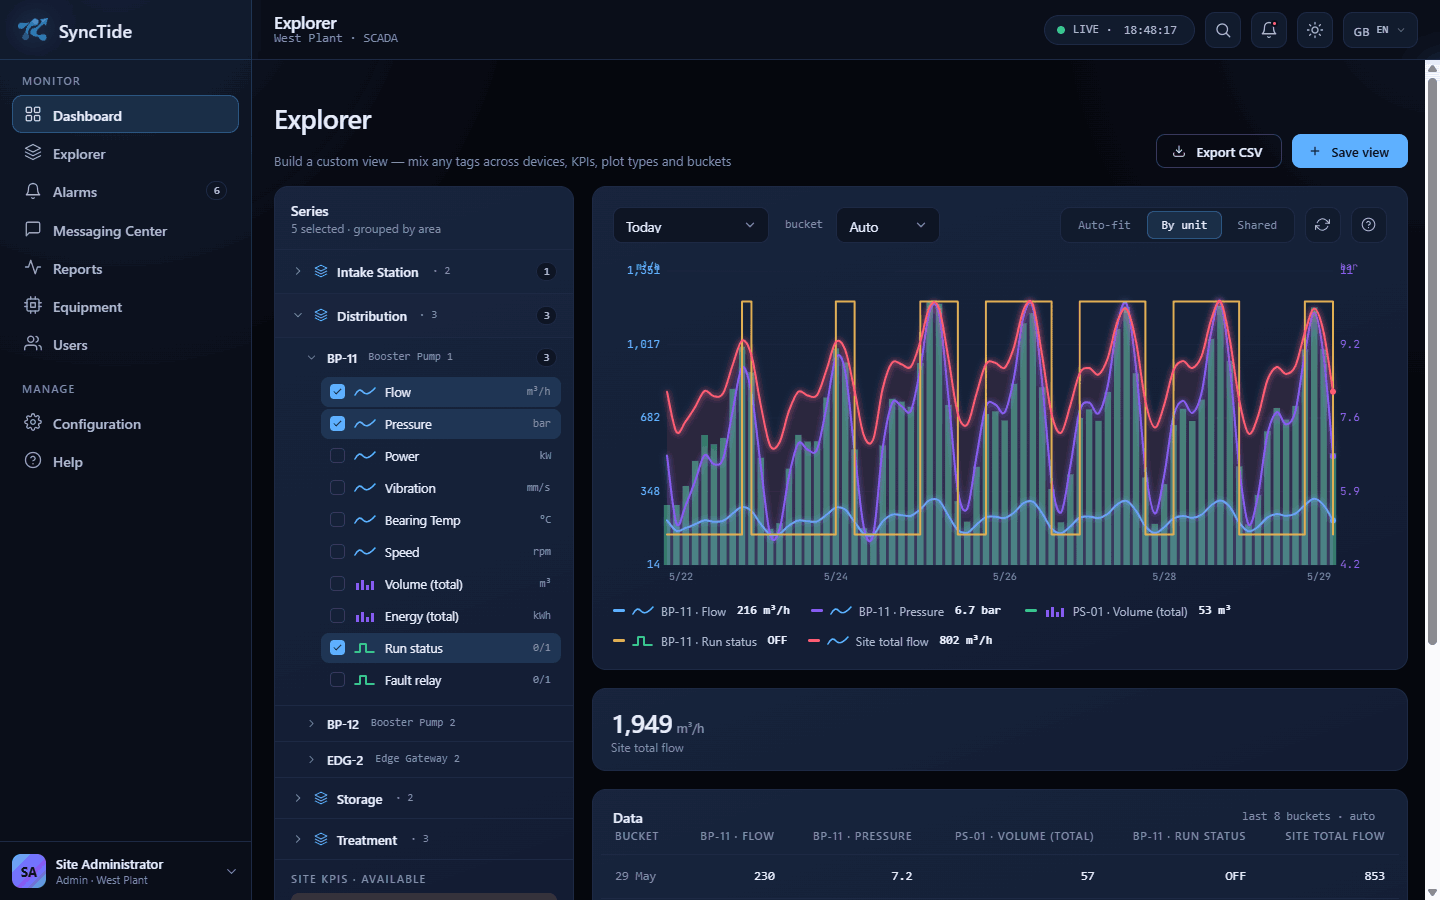
Building a view
- Expand the Series tree (Group → Device → Tag) and tick the tags you want.
- Each tag plots by its natural type — line for instant values, stepped bars for totalizers (Δ per bucket), step for digital on/off.
- Set the time interval and bucket resolution.
- Choose an axis mode: Shared, By unit (up to four axes grouped by engineering unit), or Auto-fit to normalise.
Site KPIs & export
When site-wide KPIs are defined they appear at the bottom of the series tree and can be plotted like any other tag. Use Export CSV for the plotted data, or Save view to keep a layout you return to often.
Alarms & acknowledgment
Alarms are raised by rules attached to each tag (set up in Equipment configuration). This chapter covers what you see and do as an operator.
Severity at a glance
Open alarms are ranked by severity so the most important sit at the top:
| Severity | Typical use |
|---|---|
| Critical | A value past a hard limit needing immediate action — e.g. level below critical setpoint, bearing temperature high-high. |
| Warning | A value trending out of band that should be watched — e.g. discharge pressure above band. |
| Info | A noteworthy state change, e.g. a pump stopped for standby duty rotation. |
Acknowledging & escalation
Acknowledge from the Dashboard, the asset tree, or by replying to the notification message itself. When a message includes an ACK token (e.g. Reply ACK-abc123 to acknowledge), you can acknowledge by:
- Replying with the ACK token over SMS or WhatsApp.
- Clicking the acknowledgment link in an email or Telegram message.
- Acknowledging from the platform UI.
Once acknowledged, escalation stops for that alarm event. The alarm itself clears only when the value returns to normal.
Reports
SyncTide generates Excel and PDF reports from your measurement data — on demand, from templates, or on a recurring schedule.
Simple reports
Generate a one-off report by choosing a type (Excel summary or raw-data export), one or more devices and tags, and a period (Daily, Monthly, Yearly or a custom range). Click Generate; the file appears in History & Jobs to download.
Template reports
Template reports use pre-designed Excel templates with charts and formatting. Pick a device, tag and template type; SyncTide fills in the data, calculates min / avg / max, and produces a formatted file.
Scheduled reports
Set up reports that generate themselves:
- Select a report template and device.
- Choose a frequency — Daily, Monthly or Yearly.
- Set the run time (HH:MM); for monthly/yearly, set the day of month.
- Enable the job. It now runs automatically.
Scheduled jobs can be paused, resumed, run immediately, or deleted from History & Jobs.
Viewing & downloading
Every generated report lands in the History & Jobs tab. Click to preview (PDF inline, Excel as a data table) or download the file. A date-range filter helps you find older runs.
PDF generation needs LibreOffice on the server. If PDF reports fail, ask your administrator to install it — see Troubleshooting.
Messaging Center
The Messaging Center turns alarms into notifications and routes them to the right people in the right order across SMS, email, Telegram and WhatsApp.
Overview
The overview tab summarises active alarm rules, messages sent in the last 24 hours and 7 days, the delivery-rate percentage, gateway status, and recent failures with their error details.
Contacts
Contacts are the people who receive notifications. Each has a name, phone number, email and Telegram chat ID, plus an active/inactive toggle — inactive contacts are skipped. Use the pencil icon to edit, or Add Contact to create one.
Escalation lists
An escalation list sets the order in which contacts are notified during an alarm:
- Each member has a priority level (1 = notified first).
- Members at the same level are notified simultaneously.
- If no one at level N acknowledges within the timeout, SyncTide escalates to level N+1.
- A list can have a parent list — after exhausting its own members, escalation continues through the parent's.
Example. Team A (3 members) with parent Supervisors (2 members) creates a five-level escalation chain.
Alarm rules
Alarm rules connect device alarms to escalation lists and define how notifications behave:
| Setting | What it controls |
|---|---|
| Scope | A specific device + tag, or an entire alarm category. |
| Escalation list | Which list to walk through. |
| Channel | SMS, Email, Telegram, WhatsApp, Voice, or Any (default gateway). |
| Cooldown | Minimum minutes between repeat notifications for the same alarm. |
| Max escalations | How many levels to process before stopping. |
| Response timeout | Seconds to wait for an acknowledgment before escalating. |
| Message template | Custom text using variables: $device_name, $tag_name, $value, $unit, $operator, $threshold, $timestamp. |
Message history
Review every sent message, filtered by status (Pending, Sent, Delivered, Failed, Acknowledged) and date range, and export the list to CSV.
Your profile
Manage your own account from the User Configuration page.
Name & password
- Update your full name.
- Change your password — you'll need your current one to confirm.
New passwords cannot match common defaults (admin, password, 123456, …).
Equipment configuration
Admin Register devices, tell SyncTide how to read them, map their tags and set the alarm rules that drive everything operators see.
Adding a device
Use the Add device expander to register a device with its code, name, alarm category and ingestion protocol (CSV, Modbus TCP, OPC UA, IEC 60870-5-104, MQTT). You can change the protocol later on the Communication tab.
Metadata
The Metadata tab edits the device's name and code, equipment group (used for filtering), model and serial number, latitude/longitude (for the map), and its hierarchical alarm category.
Communication
The Communication tab defines how SyncTide reads each device. Every non-CSV device has its own poll interval (1–86,400 s), and a Test connection button probes the device without saving anything.
| Protocol | Configuration | Tag addressing |
|---|---|---|
| CSV | Optional custom folder_path (blank = raw_data/<code>/) | Via tag mapping |
| Modbus TCP | host, port, unit_id, timeout_ms, address_offset | 40001 or hr:/ir:/di:/coil:, types int16/uint16/int32/uint32/float/bool |
| OPC UA | endpoint_url, optional username/password; polling or subscriptions | ns=2;s=TagName or ns=2;i=1234 |
| IEC 60870-5-104 | host, port (2404), common_address, originator_address, device timezone | Information Object Address (IOA) |
| MQTT / Sparkplug B | Pick a broker (defined under System config → MQTT Brokers) and a topic; Sparkplug B is decoded automatically | MQTT topic / Sparkplug metric name |
All five drivers ship with the base platform — no separate module to license. Each protocol runs in its own worker so a misbehaving driver can't affect the others, and OPC UA / IEC 104 devices can report by exception with a periodic heartbeat instead of constant polling.
Tag mapping
The Tag Mapping tab links raw equipment tags to standardised system tags. Each row maps an equipment tag name to a system tag (standard name + unit), sets a scale factor for unit conversion (default 1.0), and toggles active/inactive.
OPC UA shortcut. On an OPC UA device, click Browse variables to walk the server's address space, see each variable's current value and data type, and bulk-add the ones you want straight into the tag map — no hand-typing NodeIds.
Only active, mapped tags count toward your licence tag limit.
Monitoring & alarm rules
The Monitoring tab configures alarm detection per device.
Communication timeout. Set how long a device may go without data before it is marked offline (in days, hours and minutes). With Communication Lost Alarm enabled, going stale raises an alarm that auto-clears when data resumes.
Per-tag rules. Each mapped tag can carry up to four threshold alarms (for example High-High / High / Low / Low-Low), and each rule has its own:
- Name & severity — Critical, Warning or Info, shown everywhere the alarm appears.
- Value type — Numeric (threshold), Boolean / digital (true/false edges) or totalizer (window delta).
- Operator —
<,<=,=,>,>=,!=(numeric). - Threshold — the setpoint that triggers the alarm.
- Hysteresis (deadband) — once raised, the alarm stays raised until the value crosses the threshold by this margin, so a noisy signal sitting on the limit doesn't flap on and off.
Alarms only trigger for measurements received after a rule was created or last modified.
Operating-curve alarms
A curve rule watches the relationship between two tags rather than a single value — like a pump's flow-versus-pressure envelope. Define the expected curve (a set of breakpoints, with extrapolation) plus a tolerance band, and SyncTide alarms when the device drifts outside it — an early signal of wear, cavitation or fouling. Author curves under the Alarms → Curve Rule sub-tab, with a live preview over the last 30 days.
Curve templates. Got twenty identical pumps? Define the curve once as a template and link every rule to it — editing the template propagates to all of them. The Dashboard's Curves view plots live points against the band, coloured in- or out-of-tolerance.
System configuration
Admin Platform-wide settings: paths, the standardised tag library, the category tree, and your licence.
Runtime configuration
- Raw data folder — where CSV files are read from.
- Reports output folder — where generated reports are saved.
- Report templates folder — where Excel templates live.
- Ingestion interval — how often (seconds) SyncTide checks for new CSV files (minimum 15 s).
System tags & virtual tags
System tags are the standardised names (with units) used across every device via tag mapping. Add, edit or deactivate them here.
Virtual tags are derived from a sandboxed expression over tags you already collect — an efficiency, a deviation, a running total. Scope a virtual tag to a single device, or to the whole site to build a cross-device Site KPI. Give a KPI a target value and a tolerance ±%, and SyncTide colours it by deviation and lets you alarm on it like any other tag.
MQTT brokers
Register the MQTT brokers your plant publishes to — host, port, optional username/password and TLS. Once a broker is defined here, MQTT / Sparkplug B devices in Equipment configuration simply pick it and subscribe to a topic. Sparkplug B payloads are decoded automatically.
Alarm categories
Build a hierarchical category tree to organise devices. Create categories with a name, icon and optional parent; devices are assigned to categories in Equipment configuration. Categories drive the asset-tree display and category-scoped alarm rules.
License management
The License tab shows your current entitlement and lets you upload a new .lic file.
| Field | Meaning |
|---|---|
| Customer | Licensed organisation name. |
| Tier | Sets the tag ceiling: Starter (50), Standard (250), Professional (500), Enterprise (1,000), Industrial (2,500) or Unlimited. |
| Modules | Licensed features: Base (always included — dashboards, map, equipment, alarms and protocol ingestion), plus the optional Reports and Messaging modules. |
| Tags used | Current mapped tag count vs. the maximum allowed. |
| Maintenance expiry | Date through which updates and support are included. |
| License type | Perpetual (one-time, runs forever) or Subscription (annual term with updates and support included). |
| Binding | Locked to the server's network-adapter MAC address on Windows, or to a SYNCTIDE_INSTANCE_ID in cloud / Docker deployments. |
User administration
Admin Create accounts, set roles and page permissions, and restrict who can see which equipment.
Creating & managing users
- Click Add New User.
- Enter a username and password.
- Set the role — Admin, Operator or Viewer.
- Pick allowed pages (auto-filtered by role) and, optionally, restrict to specific equipment.
- Click Create.
From the user list you can edit a profile, toggle Active/Inactive, reset a password, or delete an account.
You cannot delete your own account, or the last active admin account.
Role permission matrix
| Feature | Viewer | Operator | Admin |
|---|---|---|---|
| Dashboard | View | View | View + export |
| Reports | View + download | View + download | Full control |
| Messaging contacts | View | Create / edit / delete | Full control |
| Messaging rules | View | Create / edit / delete | Full control |
| Messaging gateways | View | View | Full control |
| User admin | — | — | Full control |
| Equipment config | — | — | Full control |
| System config | — | — | Full control |
Equipment whitelist
Restrict any user to specific equipment:
- By category — they see only devices in the chosen categories (and sub-categories).
- By device — they see only the listed devices.
- Empty whitelist — they see everything.
The whitelist applies across the Dashboard, Reports, Map and every data endpoint.
Security: MFA & the audit log
Two account-security tools sit alongside roles and whitelists:
- Require MFA — force two-factor authentication on an account. The user is prompted to enrol an authenticator app before they can reach any data; see Two-factor authentication.
- Audit log — an admin-only record of who changed what and when (logins, configuration edits, user changes), for traceability and incident review.
Sign-in is rate-limited per IP and per user, so repeated wrong passwords are throttled rather than allowed to brute-force.
Messaging gateways
Admin Gateways are the outbound channels SyncTide sends through. Configure them under Messaging Center → Configuration.
Gateway types
| Type | Use case | Required configuration |
|---|---|---|
| Teltonika RUT241 | SMS via LTE router | Host IP, username, password, modem ID |
| Twilio | WhatsApp messages | Account SID, Auth Token, From number |
| Telegram | Telegram bot messages | Bot token (from @BotFather), parse mode |
| SMTP | Email notifications | Host, port, TLS, username, password, from address |
| Generic HTTP | Custom webhook / API | URL, method, headers, body template |
To add one: click Add Gateway, choose the type, fill the required fields, mark it Active (and optionally Default), save, then use Test Send to verify connectivity.
Telegram bot setup
- In Telegram, message @BotFather and send
/newbot; follow the prompts. - Copy the bot token (format
123456:ABC-DEF…). - Add the bot to your group chat and send a message there.
- Call the
getUpdatesAPI to find thechat_id. - Configure the gateway with the bot token; use the
chat_idas the contact's Telegram Chat ID.
SMTP email setup
For Gmail, use an App Password, not your account password:
- Google Account → Security → 2-Step Verification → App Passwords.
- Generate a new app password for Mail.
- Use
smtp.gmail.com, port 587, TLS on, your Gmail as username and the app password.
How escalation flows
When an alarm matches a rule, SyncTide:
- Queues messages for level-1 contacts in the assigned escalation list, each with an ACK token.
- If no acknowledgment arrives within the response timeout (default 300 s), escalates to the next level.
- Continues through every level — including parent-list members — until someone acknowledges or the max level is reached.
- Honours the cooldown to avoid repeat notifications for the same ongoing alarm.
Data ingestion
Admin SyncTide takes in data two ways, set per device on the Communication tab.
Live protocols vs. CSV
- Live protocol drivers (Modbus TCP, OPC UA, IEC 60870-5-104, MQTT / Sparkplug B) — SyncTide connects and reads each register / NodeId / topic, polling on an interval or receiving by exception. One worker per protocol means a misbehaving driver can't affect the others.
- CSV ingestion — drop files into the raw-data folder; the ingestion worker imports them on the configured interval.
All five drivers are part of the base platform — there's no separate ingestion module to license.
CSV file format
| Column | Required | Description |
|---|---|---|
time_stamp | Yes | Timestamp of the measurement (many formats supported). |
tag_name | Yes | Name of the measured parameter. |
value | Yes | Numeric measurement value. |
unit | No | Unit of measurement (optional). |
Delimiters (comma, semicolon, pipe, tab) are auto-detected, as are common timestamp formats including ISO 8601 and DD/MM/YYYY HH:MM:SS.
File placement & folders
Place files in the configured raw-data folder, organised by device using subfolders:
# the folder name becomes the device code
raw_data/DeviceCode_1/file1.csv
raw_data/DeviceCode_2/file2.csv
- Files are tracked by SHA-256 hash — the same file is never imported twice.
- Duplicate measurements (same device + timestamp + tag) are skipped automatically.
- Invalid rows (bad timestamps, non-numeric values) are dropped and logged.
- Devices are created automatically on first file import.
Backup & maintenance
Admin Keep the platform healthy: back up the database, watch the logs, and manage the services.
Database backup
SyncTide ships backup helpers — backup_platform.ps1 on Windows and backup_cloud.sh for Docker (pg_dump plus the bind-mounted folders, with rolling retention). To dump the database manually, use PostgreSQL pg_dump and schedule it with Windows Task Scheduler or cron:
pg_dump -U postgres -d synctide > backup_YYYYMMDD.sql
Log files
SyncTide writes rotating logs to the logs/ directory:
| File | Contents | Rotation |
|---|---|---|
backend.log | API server | 5 MB × 5 |
messaging.log | Messaging engine | 5 MB × 5 |
supervisor.log | Service supervisor | 5 MB × 5 |
ingestion.log | CSV ingestion worker | 10 MB × 3 |
modbus_tcp_poller.log | Modbus TCP poller | 5 MB × 5 |
opcua_poller.log | OPC UA poller | 5 MB × 5 |
iec104_poller.log | IEC 60870-5-104 poller | 5 MB × 5 |
mqtt_poller.log | MQTT / Sparkplug B subscriber | 5 MB × 5 |
Service management
On Windows, SyncTide runs as a set of services — the FastAPI backend (SyncTideBackend, which also serves the web app), one worker per protocol (SyncTideModbus, SyncTideOPCUA, SyncTideIEC104, MQTT), the alarm and ingestion workers, and the SyncTideProxy (Caddy) that puts the app on a clean LAN URL. Manage them with services.msc or PowerShell (Start-Service, Stop-Service, Restart-Service). The supervisor automatically restarts a crashed service, up to five times in a five-minute window. On Linux the same components run as containers (docker compose).
Troubleshooting
The quick fixes for the issues operators hit most — and what to send your administrator when they don't help.
Common issues
| Issue | Likely cause | Fix |
|---|---|---|
| Cannot log in | Wrong password or inactive account | Ask your administrator to verify credentials or reactivate the account. |
| No data on Dashboard | No devices selected, or no data for the period | Check the filters — devices, tags and time range. |
| Device shows grey on the map | Device not sending data | Check the device's connection and the timeout in Equipment configuration. |
| Alarm sends no notification | No alarm rule, or gateway offline | Confirm an active rule exists for the device/tag and the gateway is online. |
| Report generation fails | LibreOffice not installed (PDF) | Ask your administrator to install LibreOffice on the server. |
Getting support
If something isn't covered here, contact your system administrator with:
- Your username and the page where the issue happens.
- The exact error message, if any.
- The steps to reproduce it.
Manuals & downloads
Prefer a printable copy, or need the developer and operational references? The full manuals ship with every release as PDF and Word, alongside the in-repo operational guides.
Role manuals
User Manual
Day-to-day use: signing in, the dashboard, reading and acknowledging alarms, running reports.
Administrator Manual
Installation, user management, alarm categories, gateway configuration, backup & recovery.
Operational guides
Markdown references shipped alongside every release — the practical, in-the-field docs.
- Local install — step-by-step setup, service registration, first run.
- PostgreSQL setup — provisioning, roles, connection strings, migrations.
- Recovery — restoring from backup, rolling back a release.
- Operations runbook — triage, log map, error-to-cause table. The 3 AM doc.
- Telegram alerts (admin) and Telegram for recipients.
- Release notes — every version's changelog.